The Cash flow template…

download the excel template

Many visitors who visited my 3 parts article that talks about how to make a financial plan that rocks, and also those who red the article about “how to valuate your startup company” asked me for the template i used…

here is a link for the template, enjoy …

Cash flow planing and valuation template based on DCF

this template is well explained in the four blogs below

How to Rock your start-up project Financial plan – Part.1 (Build the template)

How to Rock your start-up project Financial plan – Part.2 (Make different scenarios)

How to Rock your start-up project Financial plan – Part.3. (Financial decision criterion)

How much your Software startup company worth

the first three blogs show how to plan your cash flow, the fourth shows you how to calculate the discount rate…

if you find it useful and helpful, please don’t forget to share it and to follow my blog.

Thank you all

banner

How much your Software startup company worth

business_valuations

Three years ago, i planned to raise an investment in my company. The first question i asked myself then was, How much equity the investor will take for the money he will invest. That was a very hard question …

The first thing came to my mind then is to go for a financial expert to do the company valuation. Their rates was shocking and i get back and decided to do it myself. From the first moment i decided that, i realized that it will take a lot of time, could be months. I am an engineer, but i already have a good accounting background from a 3 months dedicated course. And hence I started by Google and red a lot of articles about “company’s valuation” just to decide the study road map. After a one month of reading articles. i searched for a course about financing. Coursera was a very good destination and i got a course there for 8 weeks from Michigan university. After that course, i went back and red again all the articles i red before. and you can definitely say that this article is a summary of my findings. I hope you like it and find it useful, if you do please share it and leave me your feedback and comments.

For a company that all its value is in intangible asset like a brand or software or portal, You will not probably find a way to valuate it except with the “discounting cash flow” approach. In this approach, you valuate your company with the business it can generate in the future. simply, how much business you can do in the future defines your current value.

to work with this approach you need to know two major things:

  1. Your Sales and profit forecast over five years at least.
  2. The discounting Rate (the rate you going to use to discount your future cash flow into present value).

discounting approach

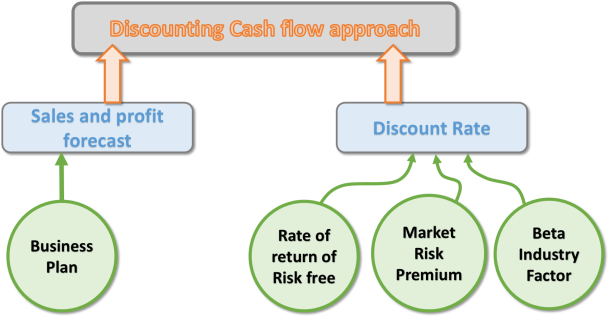
In a recent article i have wrote about “how to build a financial cash flow plan“. and Soon i will write about “how to build your business plan“. This article is focusing on how to calculate Discount rate.

A major factor in applying discounted cash flow approach is the discount rate. Discount Rate is calculated based on three sub factors, below we will talk about how these three factors are calculated and how they are affected by the country you live in. I have made two examples, one from USA where i live and invest now, and the other from Egypt, where i used to do business before.

Rate of Return of the risk free:

The risk-free rate of return is the theoretical rate of return of an investment with zero risk. It is a theoretical concept as there is no risk free business. and it is used as starting point for calculating the cost of equity and capital.  For instance, a bank considering a loan application will start with the risk-free rate and then add additional interest for other risk components such as default risk, inflation risk, and, if the loan is to a foreign company, currency risk.

Usually it is calculated based on the return on government bonds as it could be the most safe investments.

In Jan 2015

  • Return on USA ponds is expected to reach 3.4% at the end of 2015 for 10 years bond.
  • And it is almost 15.27% for Egyptian government over the same period.

Definitely we can not take the market risk free factor as a discount factor for our business. the Discount factor in other project rather than government bond is higher, because the risk is higher, so how much higher is it …

Market Risk premium:

Market Risk premium are percentages that you just pick it up from the internet, we don’t much care about how it has been calculated. It reflects the economical and political stability of the country.

As per Jan 2015:

Egypt: Moody’s rating: Caa1, country risk premium is 4.42%.
USA: Moody’s rating: Aaa, Country risk premium is 0.00%

In 2011

Egypt: Moody’s rating: Ba1, and the country risk premium is 3.6%

Ref: http://pages.stern.nyu.edu/~adamodar/New_Home_Page/datafile/ctryprem.html

Beta industry factor:

In finance, Beta is generally a measure of risk. so each industry has a calculated beta factor. it changes every year based on global economy health. You can check beta factor of each industry from this link:

http://pages.stern.nyu.edu/~adamodar/New_Home_Page/datafile/Betas.html

By jan 2015…
software (entertainment): 1.12
Software (internet): 1.19
Software (system and applications): 1.1

so based on three mentioned factors and considering that i work in the software (internet) industry then the discounting  factor in Jan 2015 is as follow:

For USA: (3.4%+0.00%) * 1.19 = 4.046%.

whereas for Egypt: (15.27%+4.42%) * 1.19 = 23.43%

Now you know the Discounting factor in which you going to use to discount all your future cash flow that your company can make … into today value.

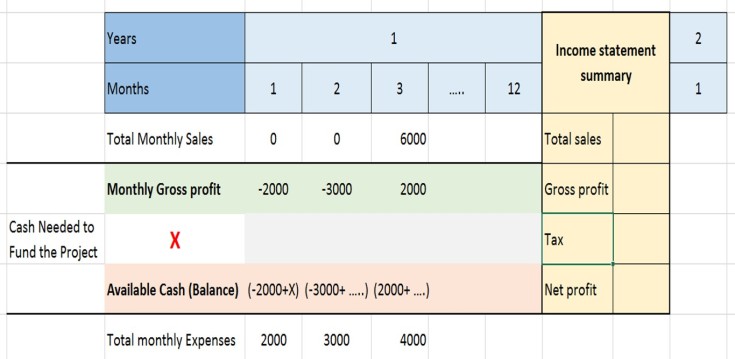
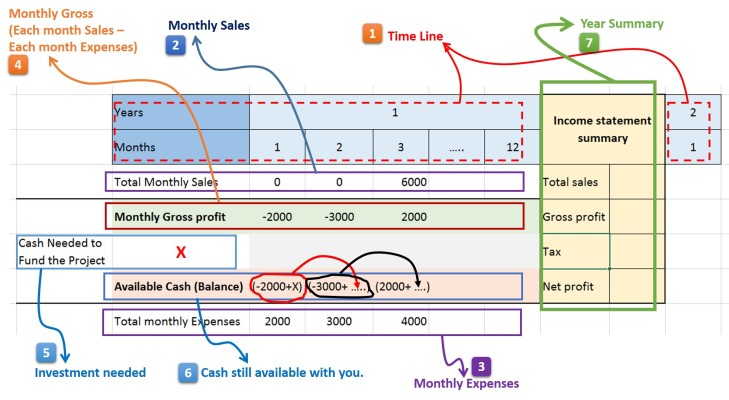
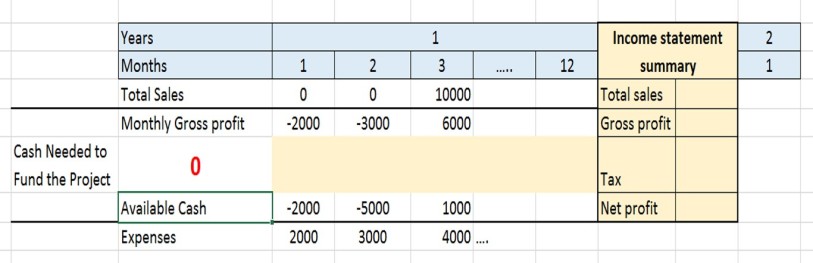
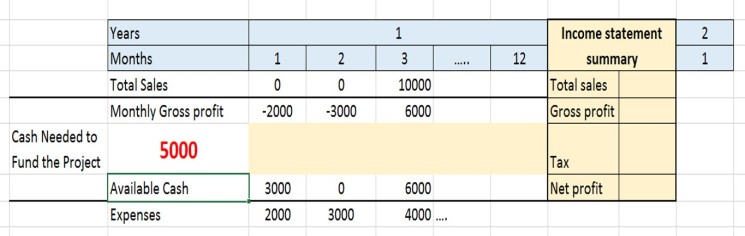
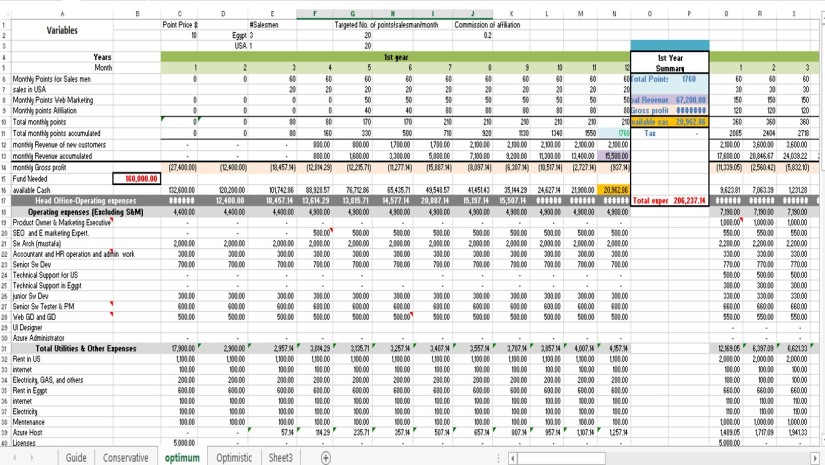
Now you must have cash flow forecast for 5 years ahead. please review my article ” How to Rock your start-up project Financial plan – Part.1 (Build the template)”  and i prefer you plan your forecast based on this template.

Also review the article “How to Rock your start-up project Financial plan – Part.3. (Financial decision criterion’s)”  to know how to calculate your project Net present value. when you calculate your Net present value, you will use the discounting factor we calculated before.

Many entrepreneurs stop here and assume that the NPV is equal to their startup value, actually i did that before… 🙂

I think you may do that, if your idea is not tested in the market yet, and you have no good prove that your idea can fulfill and meet your forecast expectations. But if your idea is already generating money and you used your cash flow history as a prove that you can fulfill and meet your forecast, then your will be less estimating your company value if you sold it at the NPV.

You have calculated your NPV based on a 5 years cash flow. In real life, your project will not stop and terminate at the end of the 5 years… right ? … your project will continue generate money, and the company could last for decades making profits. how do you include this factor.

Here comes a factor named:  Perpetuity net cash flow (NCF). A perpetuity is a constant stream of identical cash flows with no end. we will keep things simple and make it equal to the net profit at the end of the fifth year. (assuming that you continue generate the same profit every year, not more nor less)

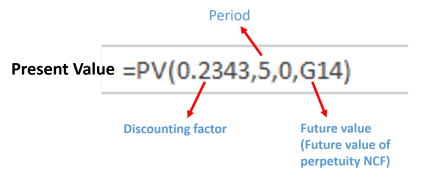
Then we will calculate the “Future value of perpetuity NCF” by dividing the perpetuity NCF over the discount rate calculated above.

Then we will calculate the Present value of the Future value of perpetuity NCF.

And finally the project value is equal to the NPV over the 5 years and the present value of the Future Value of perpetuity NCF.

Feeling lost 🙂 …. here is the Example…

I will make an example using a cash flow stream of one of my projects. i will assume that the project will have the same cash flow stream in Egypt and USA and valuate the project based on the discounting rate calculated above.

In Case the project is valuated in Egypt:
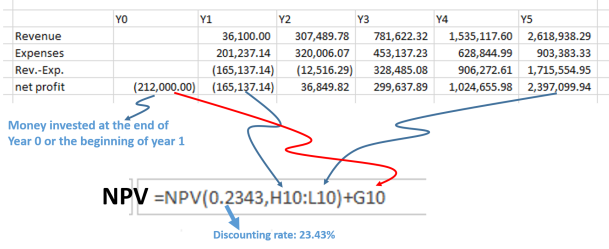
eGYPT

NPV = 1,115,929.50$
Perpetuity net cash flow (NCF) = 2,397,099.94$ (net profit in the last year).
Future value of perpetuity NCF = Perpetuity net cash flow / Discount factor = 2,397,099.94/0.2343 = 10,230,900.30$
Present value of perpetuity NCF = 3,571,167.39$ (see the following figure to know this value is calculated)

Then the company value Equals 1,115,929.50 + 3,571,167.39$ = 4,687,096.89$

PV

Now lets repeat it with the discount factor in USA.

NPV = 2,769,570.18$
Perpetuity net cash flow (NCF) = 2,397,099.94$ (net profit in the last year).
Future value of perpetuity NCF = Perpetuity net cash flow / Discount factor = 2,397,099.94/0.04046 = 59,246,167.56$
Present value of perpetuity NCF = 48,588,408.69$

Then the company value Equals 2,769,570.18 + 48,588,408,69$ = 51,358,050.87$

An important note i should mention here, is that i compared USA to Egypt, assuming that the project will make the same cash flow stream in both countries which is not right, and assuming the same taxation rate, which is not right too.
I just fixed these two conditions to have some insights on the effects of Risk free return and market risk premium.

I did my best to simplify it, if you have a basic knowledge about financing, i mean you know about the NPV, FV, …etc. then mostly you will not find a problem understanding this article. If not, you may need to read about it from the internet. and you may follow the steps i provided to you in this article even if you don’t fully understand it.

Finally, if you like it please share it. If you have any question, i will be very happy to answer you…

You can also download the template from Here
download the template

How to Rock your start-up project Financial plan – Part.3. (Financial decision criterions)

financial decisions

How can you impress your investor if he is not in your business domain and can’t understand your idea… the only way is to talk with the money language. Financial decision criterion’s are the alphabetic of the money language in this area.

Here i will talk about three important criterion’s, Breakeven point, Pay Back period, and Net present value.
In my business plans, i usually go far for more criterion just like the profitability index PI and Internal rate of return IRR. I encourage the reader to take any free course on financing from any MOOC sites like Coursera.

Breakeven point…

This is the point in time when your project revenues start to cover your expenses.
When you start your project, you will cover your expenses from your own personal savings or some kind of investment till the project starts to make revenues that can cover your expenses.

In the template we built together in part.1 and part.2, it is the point in time where your gross profit converts from negative to positive value.

why it is important, simply because it gives a clear message on how much time you need till your project becomes independent of any external financial support.

Pay Back period…

It is the point in time where your project net profits reach a value similar to the amount of money invested.
why it is important, simply because it gives the investor some insights about the time needed to get back his investment.

Net Present Value…

If you have a 1000$ now, and you invested it in a project with interest of 10% per year. Then 1000$ today will be 1100$ after a year. and hence to know the present value of a future value, you should discount it with the same interest rate. So the present value of a 1100$ future value after a year with discount rate 10% is 1000$.

npv1

But in real life, we have projects that extend over time, may be several years, so we need to discount these values over time to have what we name the net present value.

NPV is the value of specific stream of future cash flows presented in today’s dollars

npv2

NPV is based on the concept that money now is more valuable than money later on. … Why, because you can use the money to make more money.

NPV could be the most important decision criteria. it is used to know the approximate value of the project and is also used to compare between two projects.

I will not go in mathematical details on how to calculate the NPV. I Just want you to feel the meaning of it. Rather i will show you how to calculate it using excel on the template we discussed in the Part.1 and Part.2

In part.1 and part.2 we learned together how to build the template and then how to build different scenarios of it. Now i want you to make a summary for each plan you have just like what i did in the figure below:

cash flow summary

Y0: represents the first day in your project.
Accumulated cash: represents the cash in hand at the end of each year after deducting all expenses and taxes. you can say it is the net profit of each year.The accumulated cash at Y0, represent the cash in hand at the project start date which is your finance or investment.

The NPV is calculated with the npv formula in excel as in the figure below:

npv calculation in excel

The question here is how to chose the discount rate… actually there is no certain way to calculate it. It could be affected by many factors such as inflation rate, interest rate of another competing project, interest rate on treasury assets, and so on.

So this will depend on the project nature, and the country you live in.

I just finished my series on how to build a financial plan for a start-up that can rock. if you have any questions or suggestion for any enhancements, please mail me or leave your comments.

In a later article, i will talk about “how to valuate your project” especially if you don’t have any assets and the project will result in an intangible assets.

How to Rock your start-up project Financial plan – Part.2 (Make different scenarios)

different scenarios

In part.1, we talked about how to build a flexible template that will allow you to forecast your cash flow.
Before you  go working on this template, you probably have a business plan that describes the market you are targeting, and your capabilities in acquiring a certain market share. The business plan also probably describes your expectations of the economy in the few coming years.

We all know that, no business grows linearly, because markets and economics do not do . … right ?!!!
Nowadays, a lot of surprises happen…

company growth patterns

  • Financial crises in 2008 caused a major economic recession worldwide especially in USA, and Europe.
  • Revolutions and the political instability in the middle east affected the market there and a lot of surrounding and dependent markets.
  • Any price move in oil causes a lot of sequences in the whole world.
  • A natural disaster in the far east can affect computer components prices worldwide!.

These above are sample issues that we can hardly expect. But on the other hand you can also face the following cases:

Black swan

When you present your project to an investor, he might dig into these details. You should expect that, and be able to discuss it. Expect the worst.  Read about the Black Swan effect.

When you first start with the template, start working on the optimum plan. Optimum plan is the plan based on the current given assumptions for the Economy and business risks. If numbers are working good with this plan, you have a chance to convince an investor, and if not, i encourage you to stop and rethink of your idea. And see what it takes to enhance your numbers. Please read about “lean start-ups“.

Then go plan for the Conservative case, where you over estimate risks, and plan even for things that are unlikely to occur. If you have a good idea, then this plan will show how much your business is immune for economical disasters.

Finally go plan for the optimistic case, where you show what would happen to numbers if things go better than our expectations.

Also another reason for having three plans is that in a good business, things starts slow and then accelerate.

exponential growth

As an example, I work in the Cloud business domain. In a good cloud business, revenues grow exponentially, as shown in the figure. So when i made my three scenarios (Conservative, Optimum, and Optimistic) financial plans for the project i am working on, the three scenarios was not only to show how much the business is immune and promising at the same time, it was also to simulate three different periods.
The 1st period where revenues are growing very very slowly. The investment will be used to cover expenses in this period.
The 2nd period where revenues are growing good.
The 3rd period where revenues are booming.

Although you may make a one plan with three different scenarios over three periods of time, but i prefer to do three different plans…

3 different plans

Note the following.

  • The conservative plan, will be the plan that needs the biggest investment, because the period where you need cash to cover your expenses will increase. So you have to think in which plan you going to ask for investment.
  • when you move between the different scenarios, do not alter the revenues only, think also about the expenses. It is logically that when sales figures are doing good, is that you spend more in marketing.

when you finish your plans, please draw the following graphs so you can feel how your business is going to perform.

  1. comparison between the three different plan revenues.
  2. for each plan, draw a graph for the following:
    1. Revenues.
    2. Expenses.
    3. Revenue – Expenses (which is almost the gross profit).
    4. Accumulated cash (which is the net profit, that can be distributed to share holders).

Below are examples for these graphs from a project i am working on (any one need to invest 🙂 )

sales comparison

Conservative

Optimum

Optimistic

Now go do it yourself and feel the numbers….

waiting your comments

How to Rock your start-up project Financial plan – Part.1 (Build the template)

Cash Flow

Want to rock your business plan to impress an investor, then have a good financial plan. Most of investors first look at numbers, or more specifically the Financial decision criterion’s, and then will go deep with you into more details on how you gonna achieve these numbers. But first you have to influence them with numbers.

This article will be in three parts:
Part.1: Build the template: in this part you will learn how to build your financial cash flow plan. Financial data in this cash flow plan will be used to calculate the Financial decision criterion’s.
Part.2: Have different scenarios. No business grows linearly, in the first stages you may make small profits, in a later phases you make bigger profits. in this part of the article i will give you some hints on how to build different scenarios. …Read part.2
Part.3: what are the financial decision criterion’s and how they are calculated and presented…. Read part.3

Plan for your cash flow by building the following template in any spread sheet program.

Cashflow 1

1- “Time Line” which is the template header. You going to build your cash flow forecast over 3 or 5 years divided into months.

2- “Monthly Sales” This is where you list the sales done in each month. In the template we can see that sales in the first two months are zero, and 6000$ in the third month. Of course you can extend your sales rows into your different sales channels such as online sales, sales through partners, direct sales, …etc and sum them all in the “monthly sales” row.

3- “Monthly Expenses”  where you write your monthly expenses. Also you can detail the expenses, so you list salaries, office expenses, Marketing expenses,..etc. then sum them all in the “Monthly Expenses” row.

4- “Monthly Gross profit” This is the monthly profit (each month sales – each month expenses). You can see that in the first two months we don’t have sales but have expenses, and hence the monthly gross profit is in negative value.

5- “Investment needed” or the cash needed to fund the project. wither it is a loan, fund, or money savings, this is the money which will cover your expenses. When you first start building your template put it with zero value. lets name it (X).

6- “Available Cash (Balance)” each time you spend money on expenses, your cash balance decrease. And each time you make sales, you cash balance increase.
the balance of the 1st month = the Gross profit of the 1st month + Investment needed.
the balance of the 2nd month = the gross profit of the 2nd month + the balance of the 1st month.
the balance of the 3rd month = the gross profit of the 3rd month + the balance of the 2nd month.
….
the balance of the any month = Gross profit of this month + the balance of the last previous month.

7- “year summary” this is something like a simple income statement for the year.
Total sales: is the sales summation of all monthly sales.
Gross profit: is the sum of gross profits of all months in the year.
Tax: depends on your country and state laws.
Net profit: Gross profit – Tax.

 Example

example

In this example, we did not have any sales in the first two months, and hence the “available cash” is in negative value. In the third month we had a 10000$ sales, and hence we have 1000$ cash in hand.
Again, how we get the 1000$.
Sales in the 3rd month: 10,000$  |   Expenses in the 3rd month: 4000$
Then gross profit of the third month: 10000 – 4000 = 6000.
Available cash of the third month = available cash from the previous month + Gross profit of this month.
= -5000 + 6000
= 1000$

So can you tell me the investment needed to cover this project !!!
simply, it is the summation of all negative values in the monthly gross profit row, which is the summation of all losses…Sound logic 🙂

see the same example with value of 5000$ as fund.

example2

See what happened. The 5000$ is the amount that will cover you till you can make money that can cover your expenses. This point in time is named “the breakeven point“. So, the breakeven point of this project is two months.

remember this factor because it is one of the financial decision criterion.

Now try to practice this template with yourself. once you start in it, you will add more details and enhancements. the figure below shows a financial plan for a project i am working on. Just look how much details are presented. i started with this simple template and the work extended with me to this.

example3

If you have any questions please leave it in the comments.

Please follow the blog so you get an email when i publish part.2 and part.3.